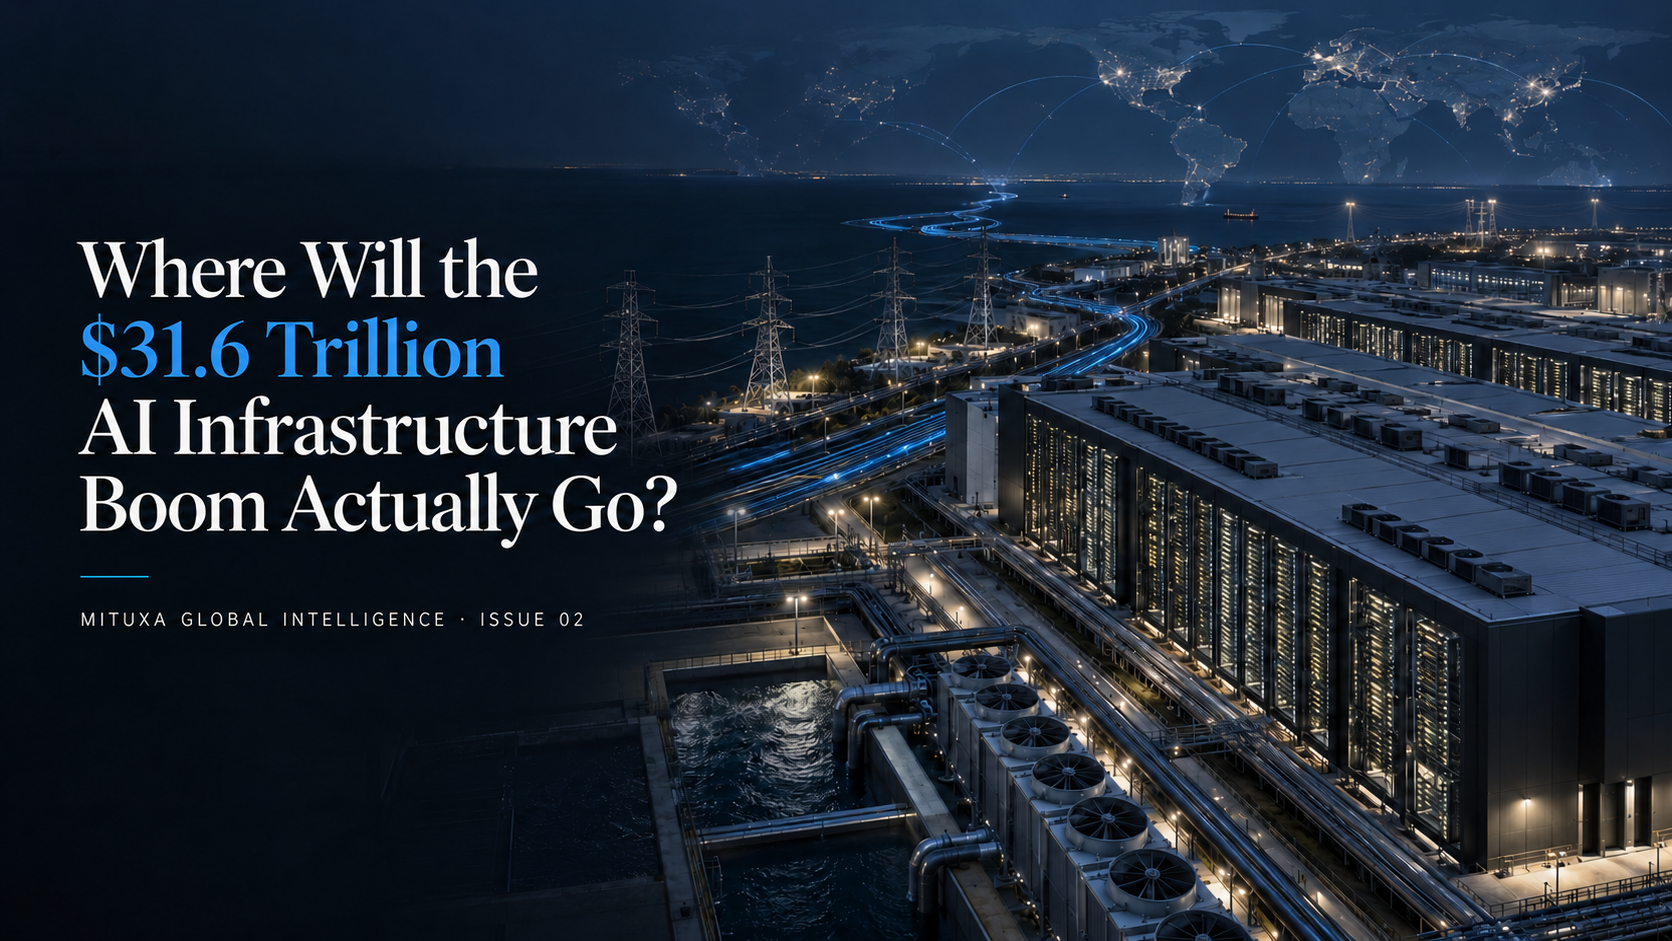
The headline is almost too large to process: $31.6 trillion of cumulative global data-centre capital expenditure through 2050 in PwC’s central scenario. Yet the most important finding is not the total. It is the shape of the spending.
Unlike railways or telecom networks, this build-out does not end when the physical infrastructure is complete. The building may last for decades; the compute inside it must be refreshed repeatedly. That makes AI infrastructure a recurring technology cycle wrapped inside a power-intensive real asset.
The scarce asset is not capital. It is deliverable, resilient power — and the ability to turn it into productive compute.
The central signal
PwC’s model suggests that annual data-centre capex could rise from about $800 billion in 2026 to $1.1 trillion in 2030 and $1.8 trillion in 2050. ICT equipment is expected to grow from 70% of total spending to 93%. The report estimates that every dollar spent on construction can effectively commit roughly twelve dollars of future ICT equipment spending.
The engine is the replacement cycle. GPUs, servers, storage and networking equipment may turn over every four to six years, implying three to five technology refreshes during the life of a data-centre asset.
Reported facts
Source: PwC commissioned Oxford Economics to model 46 countries and territories across five regions. Figures are expressed in real US dollars at 2025 exchange rates. The scenarios are not probability-weighted.
- The Americas account for $16.5 trillion in the central case, including $15.1 trillion in the United States — around 48% of the global total.
- Asia-Pacific receives $8.2 trillion; Europe $5.6 trillion; the Middle East $1.1 trillion; and Africa $255 billion.
- PwC estimates that roughly 30% of current workloads have localisation requirements, a share it expects to increase.
- When advanced-chip trade is heavily constrained, cumulative capex falls to $25.5 trillion. Under a sovereignty-led scenario it falls only to $29.5 trillion, but shifts towards domestic markets.
- Power availability ranks first among five location forces, ahead of connectivity, trusted-region security, chip access and policy certainty.
Where the money may go
The market narrative — the closest thing to a broad consensus — is that semiconductors and data-centre suppliers benefit together. MITUXA’s interpretation is more selective. The stack has different asset lives, bargaining power and failure modes. Exposure is not the same as value capture.
Compute, memory and fabrication
Accelerators, servers, memory and semiconductor equipment absorb the largest recurring pool of capital. NVIDIA, AMD, Broadcom, Micron, TSMC and ASML illustrate the stack — but rapid obsolescence and high expectations make entry price decisive.
Networking and optical transport
More compute requires more bandwidth inside and between data centres. Arista Networks, Ciena, Broadcom and Ubiquiti offer different exposures, with different customer concentration, cyclicality and valuation risks.
Power management and cooling
Rack density turns electricity conversion, backup power and thermal management into mission-critical systems. Vertiv, Eaton, Schneider Electric and Munters are representative beneficiaries — provided orders become durable margins and cash flow.
Grid and generation capacity
Transformers, substations, transmission and firm generation determine which announced projects can actually operate. This layer may capture value for longer, but permitting, regulation and capital intensity can limit returns.
Cybersecurity and sovereign infrastructure
More local and regulated workloads expand the attack surface and the need for trusted hosting. Palo Alto Networks, CrowdStrike and Fortinet illustrate the security layer; thematic relevance alone does not guarantee superior economics.
The geographic map
The United States begins with the strongest combination of hyperscalers, model developers, capital, talent and chip access. That makes it the largest winner if adoption accelerates — and the largest absolute source of disappointment if it does not.
Europe’s projected share is below its economic weight. The constraint is less a lack of demand than power, planning and fragmented regulation. The Nordics stand out because cooler climates and renewable-heavy grids improve the physical economics. Data sovereignty provides Europe with a domestic demand floor, but does not remove the execution bottleneck.
The Middle East can align power, capital and planning rapidly, yet its GPU-heavy ambitions are unusually exposed to chip controls. Africa is smaller, but its investment is more foundational: cloud, storage and connectivity can create value even if frontier AI adoption disappoints.
Valuation: the second filter
Much of the first-order AI supply chain is already priced for sustained growth. That does not make the theme wrong; it changes the burden of proof. At elevated expectations, revenue growth without margin durability, cash conversion or return on capital is not enough.
Do not buy the forecast. Underwrite the company, the competitive position and the price. Prefer businesses whose economics improve as the bottleneck tightens — and whose valuation can still survive a slower adoption path.
Risks and invalidation
The central case would weaken if AI monetisation fails to support hyperscaler capex, if better chips reduce electricity and hardware demand faster than new applications expand it, or if grid delays turn announced capacity into stranded commitments. Export controls, community opposition, financing costs and overbuilding can also redistribute or destroy expected returns.
For MITUXA, the thesis would require reassessment if annual capex ceases to progress towards PwC’s 2030 path, equipment replacement cycles extend materially beyond four to six years, utilisation and long-term lease commitments weaken, or order backlogs and book-to-bill ratios deteriorate across power, cooling and networking suppliers.
What we are watching
- Hyperscaler capital expenditure relative to disclosed AI revenue and free cash flow.
- Megawatts energised — not merely announced — and the length of grid-connection queues.
- Transformer, switchgear and cooling backlogs, lead times and book-to-bill ratios.
- Rack density, liquid-cooling adoption and optical/networking growth.
- Server and accelerator replacement cycles: whether four to six years remains realistic.
- Lease commitments, utilisation and counterparty quality across hyperscalers and neoclouds.
- Export controls, regional electricity prices and data-sovereignty rules.
- Free-cash-flow conversion and return on invested capital at the supposed beneficiaries.
Beyond the obvious
The obvious conclusion is that AI infrastructure will absorb extraordinary capital. The deeper conclusion is that this capital will be distributed by physical and geopolitical constraints, then captured according to competitive economics.
Watch the bottlenecks, not the headline TAM.
Sources
PwC — Global Data Centre Outlook 2026–50 ↗
PwC — Global investment in AI infrastructure press release ↗
Reported figures are attributed to their sources. Consensus refers to the prevailing market narrative; MITUXA View is our independent interpretation. This publication is for information and educational purposes only. It does not constitute investment advice or a recommendation to buy or sell any security.